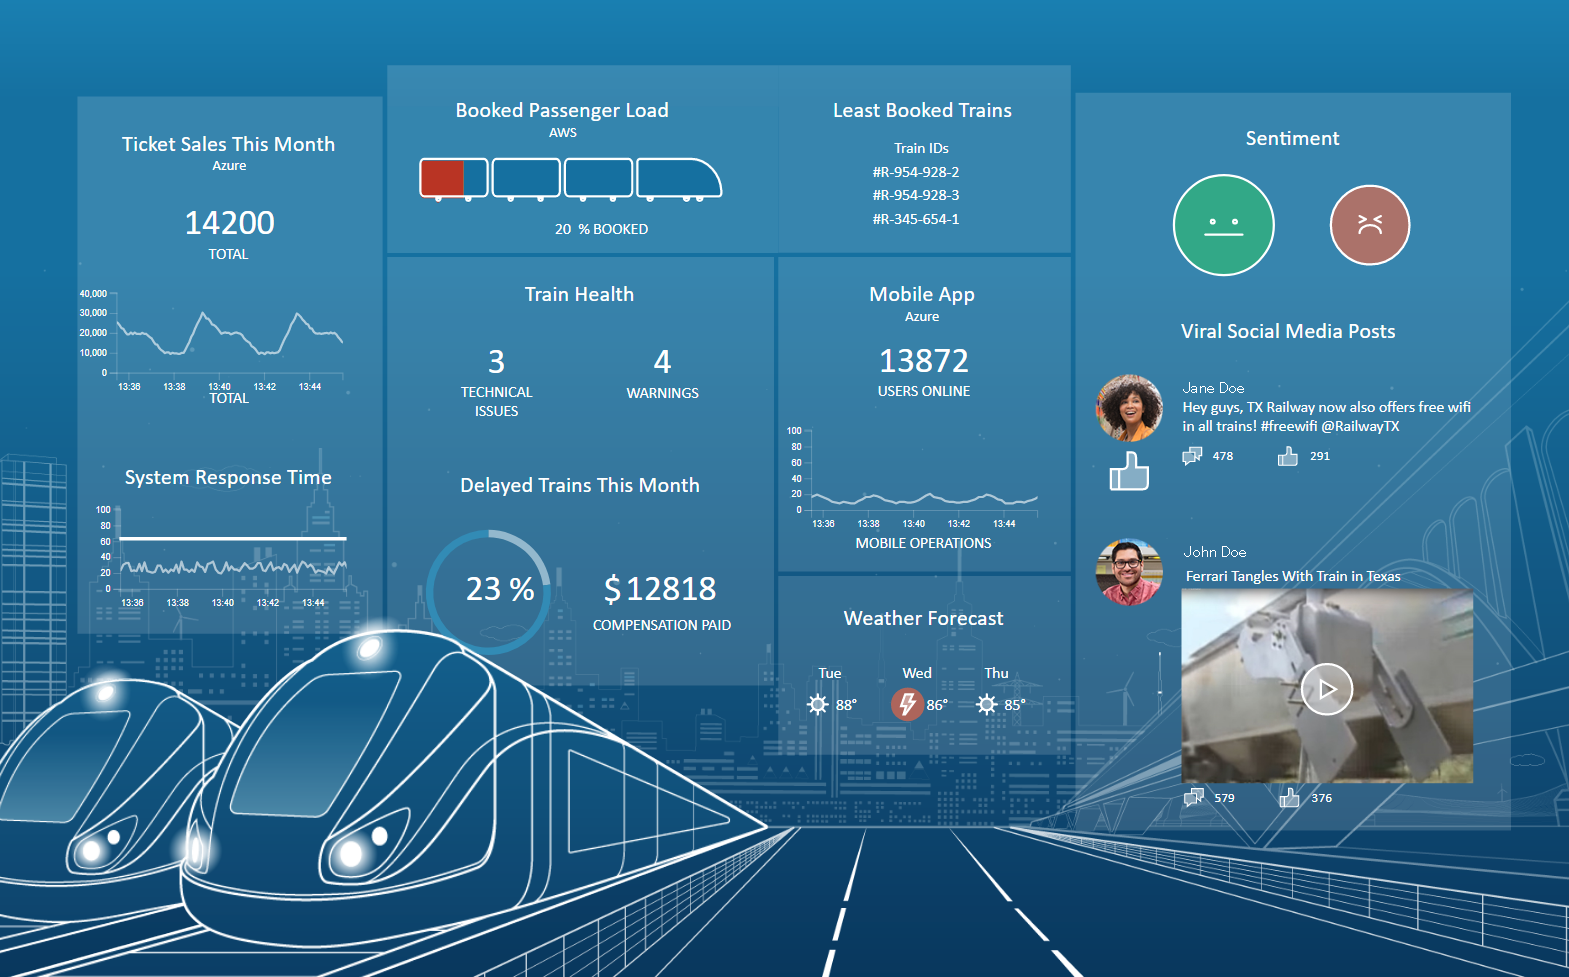
BVD can display online information such as internet news feeds, live programs, and streaming videos in dashboard views. These views can be developed by anyone using simple office productivity tools, such as Microsoft Visio, making their design flexible and easier to build and tailor, and very fast to deploy.
This doodle video is about the idea behind having a dashboard that combines business and technical data.
There are many technical videos posted on Micro Focus youtube channel that I think many of customers and partners didn’t see, This video shows end-to-end how to create a dashboard in Microsoft Visio and how to use it in Operations Bridge Business Value Dashboard (BVD).
This video includes sending data via HTTP-Post to BVD and connecting the data to BVD widgets. This video has been recorded with BVD 10.11, it is quite old but all that you’ll learn in this video can be applied to the latest version.
I hope you enjoyed it, please write us feedback on what you want us to write next!
Mahmoud Ibrahim (admin)